- Regular article
- Open access
- Published:
Use of interval-censored survival data as an alternative to Kaplan-Meier survival curves: studies of oral lesion occurrence in liver transplants and cancer recurrence
Applied Cancer Research volume 38, Article number: 16 (2018)
Abstract
After undergoing liver transplantation, children are susceptible to oral lesions due to immunosuppressant drugs that are needed to maintain the transplant. In this context, it is important to understand how disease characteristics and age at transplantation influence the development of these lesions. Monitoring of lesions begins after transplantation and children are usually observed by a specialist in stomatology at periodic visits. Consequently, lesion development is estimated to occur between two observed times, and this is characterized as interval-censored data. However, in clinical practice, it is common to assume the moment of observation as the time of event occurrence, thereby excluding interval-censored data. Here, we discuss the impact of excluding interval-censored mechanisms in statistical analyses by using simulation studies to consider differences in sample sizes and amplitudes between observed intervals. Then, application studies are presented which use a data set from a prospective study that was conducted to investigate oral lesions in patients after liver transplantation at the A.C.Camargo Cancer Center in Brazil between 2013 and 2016 and a data set involving recurrent ovarian cancer in patients diagnosed with high-grade serous carcinoma at the A.C.Camargo Cancer Center between 2003 and 2016.
Introduction
After children undergo a liver transplant, they are susceptible to oral lesions due to the very strong dose of immunosuppression medicines that are needed to maintain the transplant. Consequently, children are monitored for lesions following surgery. Stomatologists monitor children for lesions following surgery and they are interested in the influence of disease characteristics and age at transplantation on the time until lesions diagnosis, which is established as the period between the date of transplantation and lesion occurrence. In literature problems like this have been analyzed using traditional survival analysis methodologies [1].
When the event of interest is exactly observed in a time window (event observed), or when it is not observed, but it is assumed to occur eventually after such time window (censored data), there are many statistical methods that are available for estimating and comparing survival functions. The Kaplan-Meier estimator is often used to estimate survival [2], the log-rank test is the most commonly used statistical test for comparing the survival distributions of two or more groups [3], and the traditional Cox proportional hazards regression model [4] is often applied to investigate the effect of several variables on a specified event occurrence.
In clinical practice, both oral care and oral exams are performed by stomatology specialists at routine appointments following transplantation. The exact time, T, that an oral lesion appears is often not observed, but it can be narrowed to a time period between two appointments. Thus, T lies at some point within the interval [L,U], where L≤T≤U, defining interval-censored data. However, the interval-censoring mechanism is often ignored assuming the observed time as the exact time of occurrence. Moreover, researchers and analysts tend to apply traditional survival methodologies because they are easier and well-known, or because not all statistical softwares have procedures for analyzing interval-censored data.
Another important example of an interval-censoring mechanism involves time to recurrence in cancer. Often researchers consider recurrence time to be the date of the examination at which a diagnosis is made and they subsequently apply procedures to analyze right-censored data [5–9], even though recurrence probably happened between two examination appointments. However, usual survival analysis methods overestimate the survival function and this can lead to erroneous conclusions [10–12].
In the literature, several estimators of survival function are available. Currently, the Kaplan-Meier estimate is the simplest method for computing survival over time. Although, it is only adequate for right-censored data (i.e., the event occurs after the last follow-up). Another important estimator of survival is Turnbull’s algorithm [13] which takes into account interval-censored survival data. The survival curves generated with the Kaplan-Meier estimate and Turnbull’s algorithm are both easily interpreted.
Various approaches for analyzing interval-censored data have been proposed in the literature. For example, Peto [14] provided a method to estimate a cumulative distribution function from interval-censored data. This method is similar to the life-table technique and to the presented algorithm for estimating survival [15]. Semiparametric approaches based on the proportional hazards model have been developed for interval-censored data [16–21]. Moreover, a wide variety of parametric models can also be used to estimate the distribution of time to an event of interest in the presence of interval-censoring data [22–24]. In a comprehensive review, Gómez et al. [25] present the most frequently applied non-parametric, parametric, and semiparametric estimating approaches that have been used to analyze interval-censored data. Rodrigues et al. [26] presents an adequate interval censored methodology application in the boys’ first use of marijuana data set.
Here, we discuss the importance of applying appropriate statistical methods to interval-censored data, and we also assess the impact of ignoring interval-censoring mechanisms in simulation studies for several sample sizes and width of observed intervals. In all of the examined scenarios, the Kaplan-Meier estimator and Turnbull’s algorithm are applied to estimate the survival function, and these estimates are subsequently compared using an error measure.
In a simulation study three data structures are assumed: i) interval-censored data (the original mechanism); ii) substituting the unobservable failure time with the observed event moment; and iii) substituting the unobservable failure time with the midpoint of the interval during which the event occurred. These three approaches are applied to cases of oral lesion development in patients after liver transplantation and the practical relevance of ignoring interval-censored data is also discussed. The data set used derives from a prospective study of oral lesion development in patients who underwent liver transplantations at the A.C.Camargo Cancer Center in Brazil between 2013 and 2016. These three approaches are also applied to a data set of ovarian cancer recurrence in patients diagnosed with high-grade serous carcinoma at the A.C.Camargo Cancer Center between 2003 and 2016.
Briefly, the following four sections include: a presentation of basic concepts of survival analysis, Kaplan-Meier estimator and Turnbull’s algorithm (“Background” section), a simulation study with different scenarios to numerically evaluate the impact of ignoring an interval-censoring mechanism for obtaining survival function estimates (“Simulation study” section), two applications of real data sets are presented in “Applications” section, and final considerations are presented in “Final remarks” section.
Background
This section describes basic concepts of survival analysis, and therefore might be skipped by experienced readers. However, it contains notation and important results that form the basis of specific points considered in later sections.
When the primary outcome is time to an event of interest, some observations may be incomplete because the event of interest will not be observed in a pre-specified time window. Standard statistical methodologies cannot be applied to incomplete observations and remove them is not an optimal choice. Therefore, specific techniques have been developed to handle survival data. Incomplete observations are censored times in different ways due to several reasons, leading to various mechanism of censoring, defined below [27]:
-
Right-censoring: it occurs when a subject or patient leaves the study before an event occurs, or the study ends before the event has occurred. For instance, we consider patients in a clinical trial to study the effect of treatments on survival. The study ends after 5 years. Those patients who did not fail (death) by the end of the year are censored. If the patient leaves the study at time te, then the event occurs in (te;∞): For some patients censoring occurs in one of the following forms:
-
1
Loss to follow-up: the patient may move elsewhere; she or he is never seen again.
-
2
Drop out: The treatment may have such strong side effects that it is necessary to stop the therapy. Or the patient may refuse to continue the treatment.
-
3
End of study: The study ends at a predefined point of time. This type of censoring is called administrative censoring.
-
4
Competing risks: The event of interest can not be observed because of the occurrence of a competing event (for example, death by car accident).
In Fig. 1 the event times of patients 2, 4, and 6 are completely observed. The event times of patients 1 and 5 are censored because of loss to follow-up, drop out, or competing risks. Event time of patient 3 is censored because of the end of study.
-
Left censoring: it is when the event of interest has already occurred before enrolment. As an example, [26] presents boys’ first use of marijuana. A possible answer is “I have used it but I cannot remember the exactly time for my first use of the drug”, which is a left-censored observation case in the survey moment.
Fig. 1 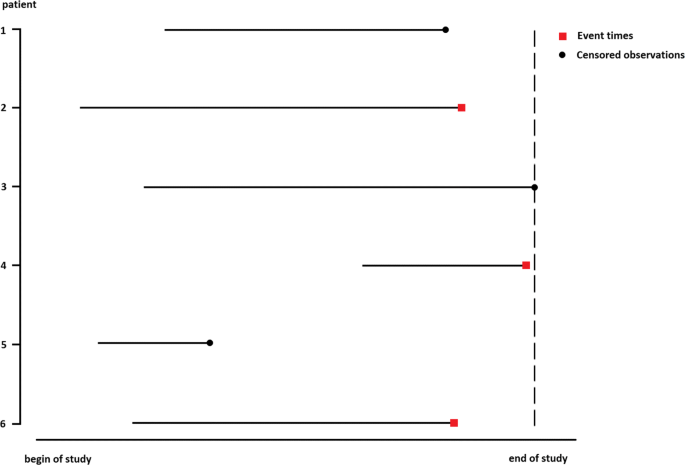
Event and censoring times of patients in a clinical trial
-
Interval censoring: it occurs where the only information is that the event occurs within some interval. Such interval censoring occurs when patients in a clinical trial or longitudinal study have periodic follow-up and the patient’s event time is only known to fall in an interval (Li, Ui], where L is the left endpoint and U for right endpoint of the censoring interval.

It is apparent that any combination of left, right, or interval censoring may occur in a study. Notice that interval censoring is a generalization of left and right censoring.
The desired quantity when modeling survival data is the survival function, S(t), which represents the probability of an individual surviving to time, t. Generally, a nonparametric procedure for estimating this survival function is applied. It is worth mentioning that for each censoring mechanism there is a specific technique to estimate the survival function as illustrated in the next subsection.
Kaplan-Meier Estimator
In medical research, the Kaplan-Meier estimator (also sometimes referred to as the product limit estimator) is widely used to estimate survival function from lifetime data. Generally, this estimation indicates the fraction of surviving patients for a given period of time after treatment. In clinical trials and/or community trials, the effect of an intervention is assessed by measuring the number of surviving or successfully treated subjects over a period of time [28]. Additional details regarding possible applications of Kaplan-Meier estimates are available in [29].
An important advantage of Kaplan-Meier curves is that they take into account incomplete observations [2, 28, 30]. For example, when subjects in a study population are only characterized by information that the event of interest did not occur before a particular time point. A censored observation contains only partial information about a variable of interest. For instance, in medical studies, data become censored when the trial observation period is shorter than the time to event. Other reasons for censoring include loss to follow-up and death due to an unrelated cause. If censored observations are not present in a sample, the Kaplan-Meier estimator is equivalent to obtaining an empirical survival distribution.
Suppose a homogeneous population has the survival function, S(t), which represents the probability that an individual will be alive at time, t, and the event of interest is development of an oral lesion. Moreover, consider a sample of n individuals from this population and that survival times are subject to right-censoring (i.e., for some individuals, the true survival times exceed the censoring time). Therefore, let t1<t2<⋯<tk with k≤n, with k≤n representing distinct observation times, dj representing the number of events at time, tj, and nj representing the number of patients “at risk” just prior to time tj. The Kaplan-Meier estimator would be defined as [2]
The Kaplan–Meier estimator is a decreasing step function which changing only at time of an event. A problematic aspect of this estimating method is that \(\widehat {S}(t)\) is not defined after the largest observation time if the last observation is a censored one. In this case, \(\widehat {S}(t)\) is usually left unspecified after the largest observation time. A consequence of this is that the mean lifetime can not be estimated. A solution for this problem is to assume that the survival function is zero after the largest time, although this obviously results in a biased estimate. Alternatively, a better solution is to consider the median survival time [27]. The median survival is the smallest time at which the survival probability drops to 0.5 (50%) or below. If the survival curve does not drop to 0.5 or below then the median time can not be computed. The mean survival time is estimated as the area under the survival curve in the interval 0 to tmax [31].
Turnbull’s Algorithm
In many practical situations, lifetime data may be interval-censored. In these situations, the time until the event of interest is not observed exactly. In such cases, the only information available for each individual is that their event time falls within an interval, and the exact time is unknown. The most basic approach for analyzing interval-censored survival data is use of a nonparametric estimation of survival function. The latter approach does not require any modeling assumptions, and thus, the estimated curves can be easily interpreted in a similar manner to Kaplan-Meier curves for right-censoring. This is usually the first analysis that is performed for survival time with interval censoring, and it can be the basis for further parametric or semiparametric analyses.
Here, we present an analog Product-Limit estimator of the survival function for interval-censored data. This estimator was suggested by [15]. However, it has no closed form and it is based on an iterative procedure.
To construct the estimator, let 0=τ0<τ1<…<τm be a grid of time which includes all points Li and Ui for i=1,…,n. For the ith observation, define a weight, αij as:
The weight, αij, indicates whether the event which occurs in the interval (Li,Ui] could have occurred at τj. An initial guess at S(τj) is made and Turnbull’s algorithm applies as follows:
Step 1: Compute the probability of an event occurring at time τj
Step 2: Estimate the number of event occurring at τj
Step 3: Compute the estimated number at risk at time τj by \(Y_{j}={\sum \nolimits }_{k=j}^{m}d_{k}\);
Step 4: Compute the updated Product-Limit estimator (1) by using quantities found in Steps 2 and 3. If the updated estimate of S(·) is close to the old version of S(·) for all τj′s, stop the iterative process. Otherwise, repeat Steps 1-3 by using the updated estimate of S(·).
Currently, there are some statistical software programs that provide tools for analyzing interval-censored failure time data. One can find some functions in R [32], STATA and SAS to solve problems when interval-censored data is present. For more details, in R see survreg() from survival package [33] and Icens package [34], stintreg function for STATA [35] and procedure LIFETEST for SAS [36].
Simulation study
In this section, we assess the impact of ignoring an interval-censoring mechanism in survival function estimates by using the following approaches: (i) applying Turnbull’s algorithm to interval-censored data (IC) (i.e., in an adequate manner); ii) applying the Kaplan-Meier estimator when the observed failure time is assumed to be the exact failure time (UL); and iii) applying the Kaplan-Meier estimator when the exact failure time is the midpoint of the interval when the event occurred (MP).
For each random sample generated, survival function was estimated according to the three different scenarios for calculating lifetimes (IC, UL, and MP). The survival function estimates were then compared with the true survival function. The goal of this simulation study was to quantify the error in the traditionally applied approaches (i.e., UL and MP), when estimating the survival function in relation to the correct approach (IC).
Various sample sizes (n=50,100,300,500 and 1000), various right-censored percentages (pc=0%,10%, 20%,40% and 70%) representing proportions of patients who did not fail during a given period, and three intervals between hospital visits (2 months, 5 months, and 8 months) were examined, thereby producing 75 possible scenarios. For each configuration, B=1000 samples were generated and a measure of MAE from the estimators to the true distribution was the comparison measure. Therefore, when \(\widehat {S}(t)\) is an estimator of the survival function and S(t) is the true survival function, then MAE was evaluated by:
where {g1,…,gℓ,…,gl}, is a grid in the space of lifetimes. Accordingly, smaller values of MAE correspond to a better estimate of survival function.
The mean and standard deviation values for 1000 MAE values obtained by the IC, UL, and MP approaches are presented in Figs. 2, 3 and 4 for the three hospital visit intervals, respectively. Overall, the IC approach produced the lowest mean MAE value for the larger sample sizes, as expected. It was also observed that increases in sample size were associated with decreases in the mean of MAE, regardless of the approach used. In the scenario of complete data (0% censoring), the IC and MP approaches exhibited similar behaviors for all three hospital visit intervals. However, as the censoring percentage and sample size increased, the IC approach exhibited the lowest MAE mean value, regardless of hospital visit interval. When the analysis is restricted to the UL and MP approaches, MP approach presented lower mean values of MAE, in general, and it is seen as the less worse approach between those who ignore the existence of interval censorship nature in data.

Simulation study. MAE (symbol) ± standard deviation of the MAE (bars) for the IC, UL and MP approaches over a 2-month interval

Simulation study. MAE (symbol) ± standard deviation of the MAE (bars) for the IC, UL and MP approaches over a 5-month interval

Simulation study. MAE (symbol) ± standard deviation of the MAE (bars) for the IC, UL and MP approaches over a 8-month interval
In general, IC approach presented better performance for all scenarios. It is also worth mentioning that the range of each hospital visit interval was found to contribute to the magnitude of these differences, with greater differences observed as the hospital visit ranges increased.
Applications
To show the applicability of interval-censoring mechanism in real data sets, we consider two studies that were previously conducted at the A.C.Camargo Cancer. The data sets are characterized by different sample sizes and distinct survival curves. In both studies, the Kaplan-Meier estimator and Turnbull’s algorithm were applied to obtain the survival rate estimates. In addition, we quantified the estimates difference from UL and MP approaches when IC approach is considered as reference.
Oral lesion data
A prospective study of oral lesion development in children younger than 18 years after liver transplantation was performed at the A.C.Camargo Cancer Center between 2013 and 2016. Researchers believe that oral lesions are a side effect of the immunosuppressive medicines that are administered following liver transplantation. Oral exams and oral care were performed by stomatology specialists during follow-up appointments. Patients were initially observed every 1–2 months. As their recovery progressed, the interval between visits lengthened. Time until lesion diagnosis was defined as the period between the date of transplantation and the time to first observation of an oral lesion. Patients who did not develop oral lesions until their last visit were classified as right-censored, and the end point of their intervals was assumed to be Ui=∞. The data set included 50 observations, with 7/50 (14%) being right-censored. The mean interval between the last two follow-up exams was approximately 2 months, while the maximum observation time was 569 days.
Figure 5 shows the survival curves that were estimated according to the Kaplan-Meier estimator and the Turnbull algorithm. In general, UL and MP estimates are higher than the IC estimates. In Table 1, survival rate estimates in 30,60,120,360 and 540 days and the MAE values of UL and MP approaches (considering as reference survival curve obtained by IC approach) are listed. It was observed that the UL approach results in greater difference from IC estimates than the MP approach.

Estimated survival functions for the oral lesion data set as calculated according to the Kaplan-Meier (K-M) estimator and Turnbull’s algorithm
Next, we consider an explanatory variable for this data set to illustrate the methods, and to assess whether it is important to explain the time until oral lesion development. Age at transplantation was selected as the variable of interest, and it indicates if the patient is younger (≤10 months of age) or older (>10 months of age). In Fig. 6, estimated survival curves according to the Kaplan-Meier and Turnbull methods are shown. These survival functions were compared with the log-rank statistic test for censoring-interval data [37], and a significant difference between the survival curves was observed.

Survival function estimates obtained with the Kaplan-Meier (K-M) estimator and Turnbull’s algorithm for patients with oral lesions that were stratified according to age at transplantation
Survival rate estimates for 30,60,120,360 and 540 days according to age at transplantation and MAE values of UL and MP approaches (considering as reference survival curve obtained by IC approach) are listed in Table 2. The corresponding estimated survival curves show that the younger patients had a better survival rate than the older patients, regardless of the analysis approach. In addition, use of the UL method for the older patient group tended to overestimate the survival curve, whereas application of the MP approach to the younger patient group showed a trend towards under or overestimating the survival curve. Meanwhile, the UL approach did trend towards overestimating the survival curve. Corresponding differences are observed in the MAE as well, and this results in greater difference from IC estimates in the UL approach, as expected.
Ovarian cancer data
The data set was obtained at the A.C.Camargo Cancer Center and it included female patients affected by recurrence of ovarian cancer. In particular, patients who were diagnosed with high-grade serous carcinoma between 2003 and 2013 were included in our data set, and follow-up exams were conducted until 2016. The event of interest is recurrence of ovarian cancer. The exact time of the start of cancer recurrence was not observed, although it was known that it occurred between the diagnosis examination and the preceding examination. Time to recurrence was defined as the period between the date of surgery to remove the primary cancer and the diagnosis of recurrence. The data set includes 47 observations, with 11/47 (23.4%) representing right-censoring observations. The mean interval between the two last exams was 6 months and the maximum observation time was approximately 8 years.
The estimated survival curves obtained by IC, MP and UL approaches are shown in Fig. 7. While these survival functions are in close proximity at some of the time points, in general, UL approach lead to an higher survival rate rather than IC and MP approaches. Table 3 provides survival rate estimates for recurrence ovarian cancer at various time according to the Kaplan-Meier and Turnbull methods, and there are differences in the survival rate values for the three approaches. For example, the estimated probability of recurrence for ovarian cancer patients beyond 24 months is 0.511 according to UL approach and is 0.722 according to IC approach. In this scenario, if the interest is the point estimate, it is evident that UL approach leads to higher survival rate compared to the use of interval-censored approach.

Estimated survival functions obtained with the Kaplan-Meier and Turnbull methods for the ovarian cancer recurrence data set
Final remarks
Interval-censored data are often presented in medical applications. However, many researchers do not take into account this mechanism when analyzing data. This may be because traditional methodologies are easier to apply and are well-known. As observed in the examples presented in this paper, when the usual methods for survival analysis are applied inappropriately, authors should be cautious regarding their conclusions. Besides, it is worth mentioning that by assuming that an event of interest occurs at the end of each interval (or at the midpoint) might lead to an overestimate of survival rates, especially when there is a large interval between the diagnosis examination and the preceding exam. We hope the analyses we have presented will help researchers better understand the implications of applying traditional survival analysis methods versus adequate methods when analyzing interval-censored data.
References
Rubin S, Randall T, Armstrong K, Chi D, Hoskins W. Ten-year follow-up of ovarian cancer patients after second-look laparotomy with negative findings. Obstet Gynecol. 1999; 93:21.
Kaplan EL, Meier P. Nonparametric estimation from incomplete observations. J Am Stat Assoc. 1958; 53:457–81.
Mantel N. Evaluation of survival data and two new rank order statistics arising in its consideration. Cancer Chemother Rep. 1966; 50:163–70.
Cox DR. Regression models and life-tables. J R Stat Soc B. 1972; 34:187–220.
Liedtke C, Mazouni C, Hess KR, André F, Tordai A, Mejia JA, Symmans WF, Gonzalez-Angulo AM, Hennessy B, Green M, et al. Response to neoadjuvant therapy and long-term survival in patients with triple-negative breast cancer. J Clin Oncol. 2008; 26:1275–81.
Mitsudomi T, Morita S, Yatabe Y, Negoro S, Okamoto I, Tsurutani J, Seto T, Satouchi M, Tada H, Hirashima T, et al. Gefitinib versus cisplatin plus docetaxel in patients with non-small-cell lung cancer harbouring mutations of the epidermal growth factor receptor (WJTOG3405): an open label, randomised phase 3 trial. Lancet Oncol. 2010; 11:121–8.
da Costa AA, Valadares CV, Baiocchi G, Mantoan H, Saito A, Sanches S, Guimarães AP, Achatz MIW. Neoadjuvant chemotherapy followed by interval debulking surgery and the risk of platinum resistance in epithelial ovarian cancer. Ann Surg Oncol. 2015; 22:971–8.
Del Carmen M, Supko J, Horick N, et al.Phase 1 and 2 study of carboplatin and pralatrexate in patients with recurrent, platinum-sensitive ovarian, fallopian tube, or primary peritoneal cancer. Cancer. 2016; 122(21).
Bahnassy AA, El-Sayed M, Ali NM, Khorshid O, Hussein MM, Yousef HF, Mohanad MA, Zekri A-RN, Salem SE. Aberrant expression of miRNAs predicts recurrence and survival in stage-II colorectal cancer patients from Egypt. Appl Cancer Res. 2017; 37(39):1–13.
Rücker G, Messerer D. Remission duration: an example of interval-censored observations. Stat Med. 1988; 7:1139–45.
Law CG, Brookmeyer R. Effects of mid-point imputation on the analysis of doubly censored data. Stat Med. 1992; 11:1569–78.
Odell PM, Anderson KM, D’Agostino RB. Maximum likelihood estimation for interval-censored data using a Weibull-based accelerated failure time model. Biometrics. 1992; 48:951–9.
Turnbull BW. Nonparametric estimation of a survivorship function with doubly censored data. J Am Stat Assoc. 1974; 69:169–73.
Peto R. Experimental survival curves for interval-censored data. Appl Stat. 1973; 22:86–91.
Turnbull BW. The empirical distribution function with arbitrarily grouped, censored and truncated data. J R Stat Soc. 1976; 38:290–5.
Finkelstein DM, Wolfe RA. A semiparametric model for regression analysis of interval-censored failure time data. Biometrics. 1985; 41:933–45. s
Finkelstein DM. A proportional hazards model for interval-censored failure time data. Biometrics. 1986; 42:845–54.
Goetghebeur E, Ryan L. Semiparametric regression analysis of interval-censored data. Biometrics. 2000; 56:1139–44.
Betensky RA, Rabinowitz D, Tsiatis AA. Computationally simple accelerated failure time regression for interval censored data. Biometrika. 2001; 88:703–11.
Lesaffre E, Komárek A, Declerck D. An overview of methods for interval-censored data with an emphasis on applications in dentistry. Stat Methods Med Res. 2005; 14:539–52.
Zhang M, Davidian M. “Smooth” semiparametric regression analysis for arbitrarily censored time-to-event data. Biometrics. 2008; 64:567–76.
Sparling YH, Younes N, Lachin JM, Bautista OM. Parametric survival models for interval-censored data with time-dependent covariates. Biostatistics. 2006; 7:599–614.
Lindsey JC, Ryan LM. Tutorial in biostistics: Methods for interval-censored data. Stat Med. 1998; 17:219–38.
Achcar JA, Tomazella VLD, Saito MY. Lifetime interval-censored data: a Bayesian approach. J Appl Stat Sci. 2007; 16:77–89.
Gómez G, Calle ML, Oller R, Langohr K. Tutorial on methods for interval-censored data and their implementation in R. Stat Model. 2009; 9:259–97.
Rodrigues AS, Bhering FL, Pereira CAB, Polpo A. Bayesian estimation of component reliability in coherent systems. IEEE Access. 2018; 6:18520–35.
Wienke A. Frailty Models in Survival Analysis. Boca Raton: Chapman & Hall/CRC; 2011.
Goel M, Khanna P, Kishore J. Understanding survival analysis: Kaplan-Meier estimate. Int J Ayurveda Res. 2010; 1:274–8.
Maller RA, Zhou X. Survival Analysis with Long-term Survivors. New York: Wiley; 1996.
Rich JT, Neely JG, Paniello RC, Voelker CC, Nussenbaum B, Wang EW. A practical guide to understanding Kaplan-Meier curves. Otolaryngol Head Neck Surg. 2010; 143:331–6.
Klein JP, Moeschberger ML. Survival analysis: Statistical methods for censored and truncated data. 2003.
R Core Team. R: A Language and Environment for Statistical Computing. Vienna: R Foundation for Statistical Computing; 2018. R Foundation for Statistical Computing. https://www.R-project.org/.
Therneau TM. A Package for Survival Analysis in S. 2015. version 2.38. https://CRAN.R-project.org/package=survival.
Gentleman R, Vandal A. Icens: NPMLE for Censored and Truncated Data. 2018. R package version 1.52.0.
StataCorp. Stata Statistical Software: Release 15. College Station, TX: StataCorp LLC. 2017.
SAS Institute Inc. Cary NC USA. 2014.
Fay MP, Shaw PA. Exact and asymptotic weighted logrank tests for interval censored data: the interval R package. J Stat Softw. 2010; 36(2):1–34.
Acknowledgements
This authors would like to thank the two referres for their comments which greatly improved this paper.
Funding
No funding received.
Availability of data and materials
The data sets analysed during the current study available from the corresponding author on reasonable request.
Author information
Authors and Affiliations
Contributions
Agatha S. Rodrigues and Vinicius F. Calsavara designed the research. Agatha S. Rodrigues proposed the article issue. Agatha S. Rodrigues and Vinicius F. Calsavara performed bibliographic surveys, simulation studies, and data sets analysis. Felipe I.B. Silva, Fábio A. Alves and Ana P.M. Vivas collected the data sets and designed the applied problems. All authors wrote/revised the paper and All authors read and approved the final manuscript.
Corresponding author
Ethics declarations
Ethics approval and consent to participate
Not applicable.
Consent for publication
Not applicable.
Competing interests
The authors declare that they have no competing interests. For author-year bibliography (bmc-mathphys or spbasic).
Publisher’s Note
Springer Nature remains neutral with regard to jurisdictional claims in published maps and institutional affiliations.
Rights and permissions
Open Access This article is distributed under the terms of the Creative Commons Attribution 4.0 International License (http://creativecommons.org/licenses/by/4.0/), which permits unrestricted use, distribution, and reproduction in any medium, provided you give appropriate credit to the original author(s) and the source, provide a link to the Creative Commons license, and indicate if changes were made. The Creative Commons Public Domain Dedication waiver (http://creativecommons.org/publicdomain/zero/1.0/) applies to the data made available in this article, unless otherwise stated.
About this article

Cite this article
Rodrigues, A., Calsavara, V., Silva, F. et al. Use of interval-censored survival data as an alternative to Kaplan-Meier survival curves: studies of oral lesion occurrence in liver transplants and cancer recurrence. Appl Cancer Res 38, 16 (2018). https://doi.org/10.1186/s41241-018-0067-7
Received:
Accepted:
Published:
DOI: https://doi.org/10.1186/s41241-018-0067-7